What are spectral emission lines?#
Heating a gas causes it to radiate light at a certain wavelength. This is the idea behind neon lights. Passing a current through the tube excites the neon atoms, causing them to glow. Each element in the periodic table has a unique glow, which distinguishes it from every other element.
Note
Here is a list of wavelengths and their associated elements from the National Institute of Standards and Technology (NIST).
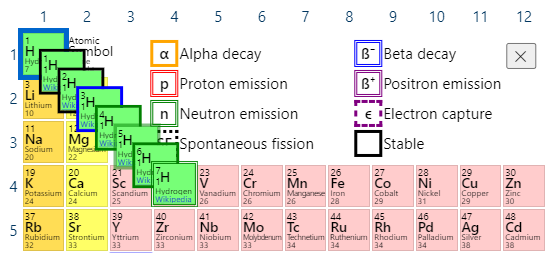
I've oversimplified by using the term "glow." In reality, what we are looking for are emission lines. Using hydrogen as an example, we have a number of different isotopes (atoms with different numbers of neutrons), but only two stable ones.
Image from Ptable.com
By heating hydrogen in a tube, and passing the light it emits through a prism, certain wavelengths of light are evident on the spectrum. These bands can be expressed using an equation called the Rydberg formula. It is illustrated in this desmos graphic.
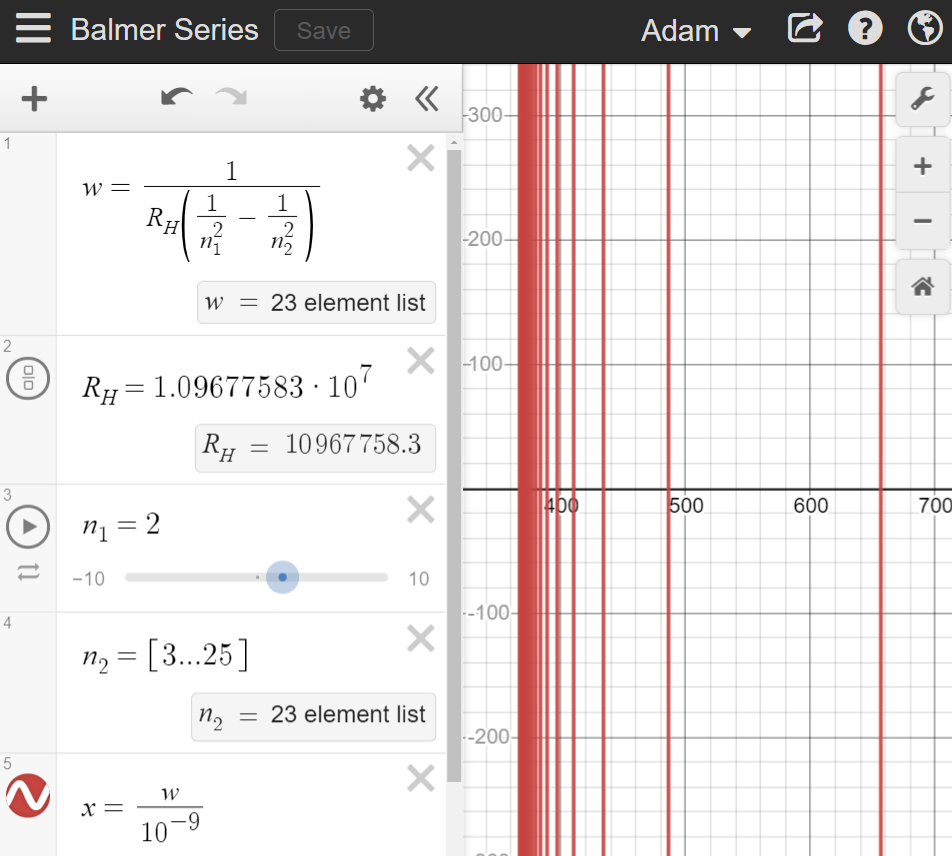
The Rydberg formula \(λ=\frac{1}{R_{H}\left(\frac{1}{n_{1}^{2}}-\frac{1}{n_{2}^{2}}\right)}\) reveals the spectral lines made by hydrogen. When an electron drops to a lower evergy level from \(n=3\) to \(n=2\), the excess energy is emitted as a photon of a specific wavelength (656 nanometers) - and so on, when dropping from \(n=3,4,5,6...∞\) down to \(n=2\).
| line | electron transition | wavelength (nm) |
|---|---|---|
| alpha | 3->2 | 656.47 |
| beta | 4->2 | 486.27 |
| gamma | 5->2 | 434.17 |
| delta | 6->2 | 410.29 |
| epsilon | 7->2 | 397.12 |
| zeta | 8->2 | 389.01 |
| eta | 9->2 | 383.65 |
Because of the way the function is constructed, there is a limit at 364.91 nm. But we can't see light at this low wavelength anyway. Our visual range for light is from 380 to 700 nm, while 364 nm is in the near ultraviolet part of the spectrum. Keep in mind, this series (called the Balmer series only drops to n=2. If we wanted to find the wavelengths for electron drops to other energy levels, we could do that - but it would be largely outside the visible spectrum.
Judging from the wavelength, the colors emitted by hydrogen in the table above would look something like this (going from lowest to highest wavelength):


Since these are the emission lines created by hydrogen, we can identify them in stars. If the lines are not where they are supposed to be in the star's spectrum, it means that they have been displaced by the Doppler effect. This implies the source of the light is either moving toward or away from us. How do you find these spectral lines in the glow of galaxies? See Stellar redshift.