Stellar redshift#
Reading stellar spectra#
Note
For some background about how the Doppler effect causes a shift in the frequency of light, please read Redshift first.
A good source of stellar spectra is the Sloan Digital Sky Survey (SDSS) Sky Server. They have imaged one third of the night sky and have included "spectroscopic data for more than three million stars, galaxies, and quasars." Unfortunately, due to the sensitivity of the camera, the brightest stars and galaxies are missing from SDSS database - and even some galaxies with data do not have spectral data.
I'm going to use M101, the Whirlpool Galaxy, as a starting place in the night sky, and then find a sufficiently dim representative galaxy in order to illustrate how redshift informs us about radial velocity and distance.
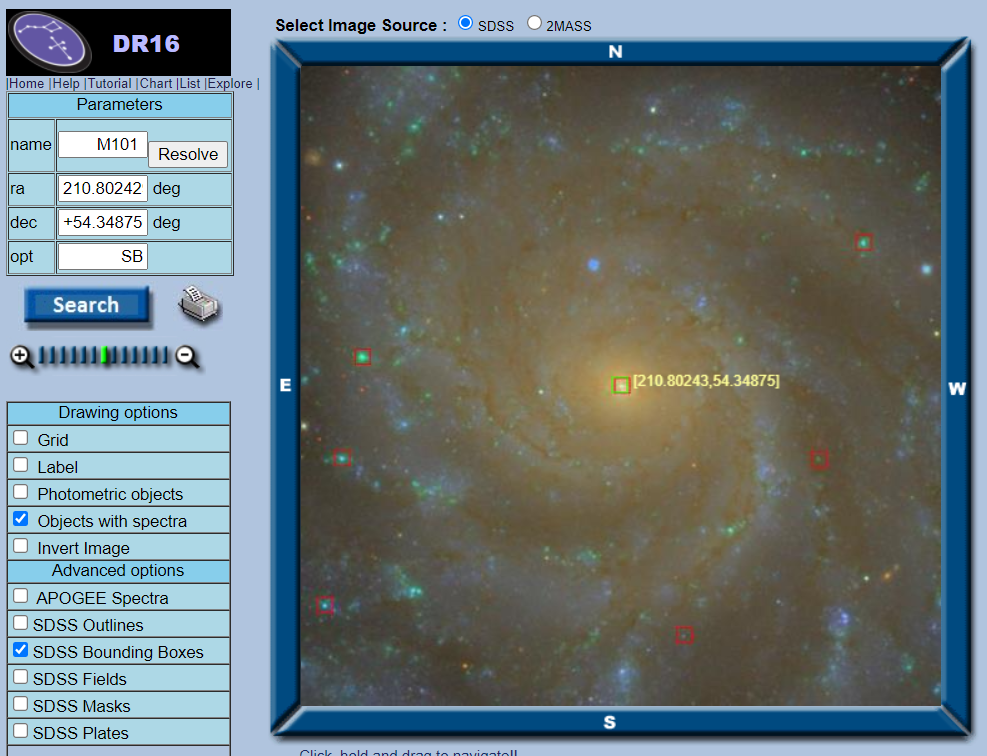
Clicking on Navigate, and with "Objects with spectra" and "SDSS Bounding Boxes" checked, pan and zoom until you find a galaxy within the pink bounding boxes with an indicated spectra. The example below is a galaxy designated SDSS J140356.58+542726.7 (this information is found by clicking "quick look"). Pasting this identification into SIMBAD gives you some information about this galaxy.
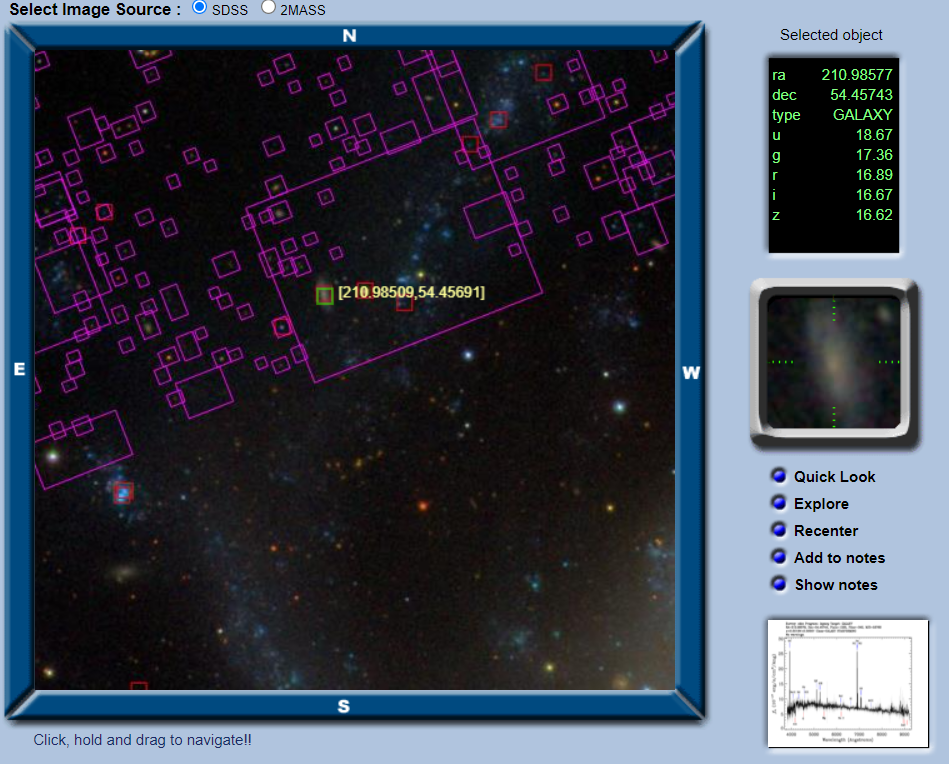
Its J2000 galactic coordinates are 101.977420 +59.622095 and its radial velocity is listed as 15,139 +-3 km/s. We are going to independently confirm this and use the Hubble Constant to determine how far away this galaxy is. In order to do that, however, we need to know something about how hydrogen gas glows.
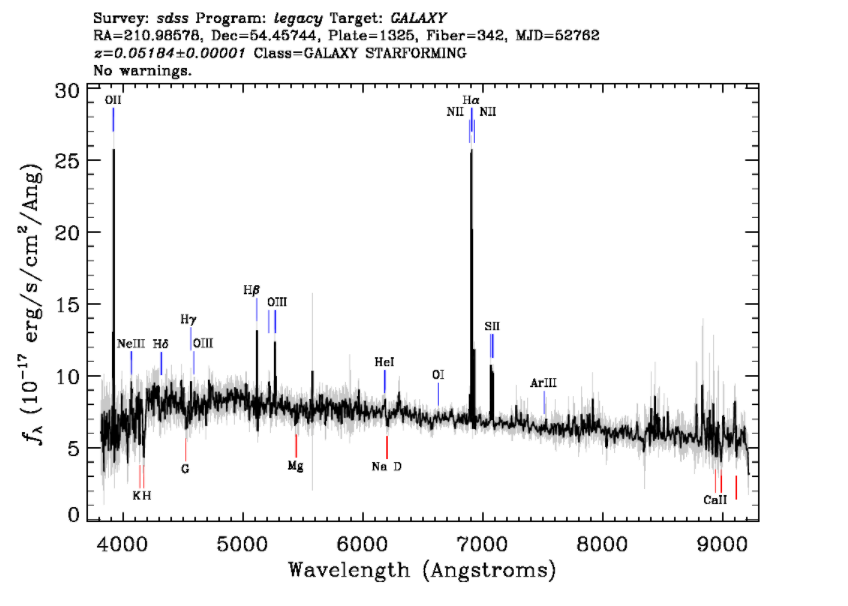
The goal is to match the known emission lines from hydrogen to the same hydrogen line pattern in the spectrum of the galaxy we are interested in. It is similar to matching tree rings. If we notice that the lines are not where they are supposed to be, it implies radial motion, either towards or away from us, depending upon the direction of the shift. Looking at the spectrum we downloaded from SPSS, the x-axis is the wavelength in Angstroms \(10^{-10}\) meters. This converts to nanometers by simply moving the decimal place one to the left, so \(6562\) Å is \(656.2\) nm.
On the y-axis, we have erg/s/cm^2/Å. This tangle of units is a measure of flux density. All sorted out, it looks like this: \(f_{λ}=\frac{erg}{s\cdot cm^{2}\cdot Å}\)